
AI compute / Monitoring
GPU Cluster Monitoring: Metrics and Troubleshooting
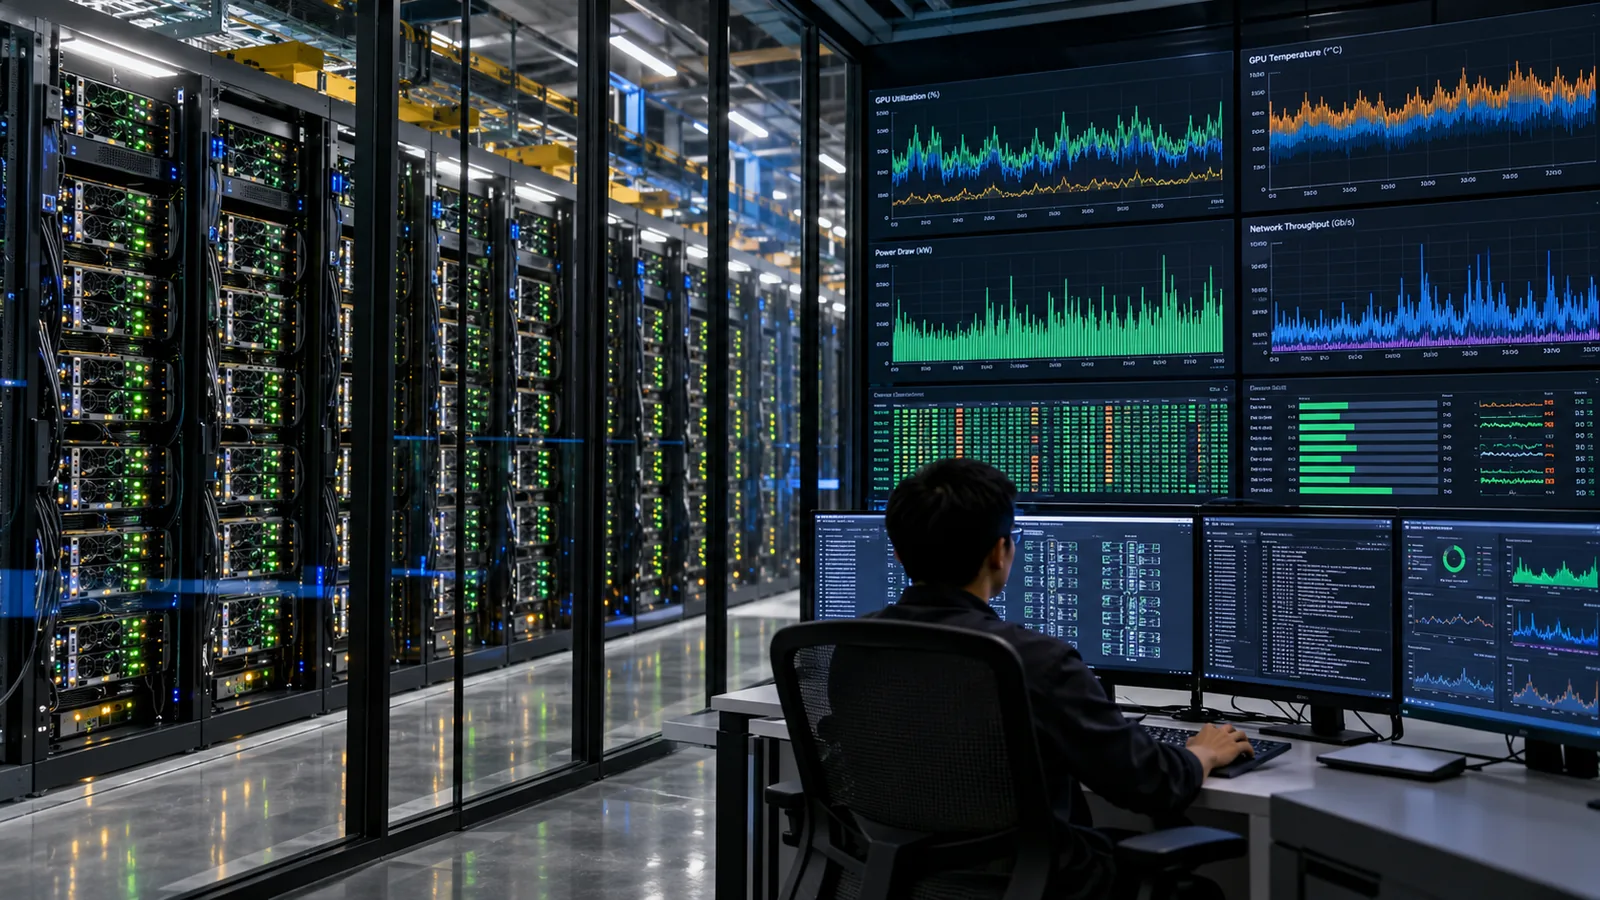
High GPU utilization is not proof of a healthy cluster. Combine application throughput, hardware errors, power and fabric data to find real bottlenecks.
Sections in this article
Your dashboard shows 98% GPU utilization across a training cluster. The job is still missing its completion target. The useful next question is not “Why aren't the GPUs busy?” but “Where is completed work being lost?” A cluster can be busy while memory transfers, straggler nodes, network congestion or repeated errors waste time.
Start with what the user or training team experiences, then narrow the search through compute, hardware, interconnect and facility measurements. GPU monitoring works best as a troubleshooting path, not a wall of unrelated gauges.
The first screen should show service and job outcomes
These are outcomes, not fixed industry targets. A model-training job, a real-time API and a batch analytics service need different service objectives. GPU percentage alone does not report that objective.
What to measure at each layer
| Layer | Useful measurements | Interpret with care |
|---|---|---|
| Application | Steps/s, tokens/s, completed requests, tail latency, retries | Compare similar model, batch and concurrency conditions |
| GPU compute | SM and tensor activity, clocks, utilization, throttling reasons | Activity is not completed useful work |
| Memory and reliability | Memory bandwidth activity, allocated memory, ECC/Xid events | Not every memory temperature field is exposed on every device |
| Fabric | NVLink/PCIe transfer rates, errors, network congestion, all-reduce duration | High traffic can be normal or indicate inefficient communication |
| Power and cooling | Board watts, energy, device thermal margin; rack input and CDU/inlet metrics | GPU telemetry and facility meters measure different boundaries |
NVIDIA's DCGM profiling documentation distinguishes SM activity, memory activity and fabric activity and notes that interval averages do not identify an individual slow kernel. Hardware availability and counters depend on GPU architecture and the monitoring stack.
Symptom-to-action guide for an operator
Check: memory-bandwidth pressure, batching, model precision and end-to-end latency. A busy accelerator is not automatically productive.
Check: per-node step time, thermal or power limit events, GPU health and fabric errors. Compare the lagging host with a matched peer.
Check: active board power limits, clock restrictions, utilization and whether the application is stalled upstream. Low watts alone is not a fault.
Check: Xid and memory-health records, device resets, workload logs and timestamp-correlated facility events before blaming cooling.
Worked triage: a 64-GPU training job slows down
Imagine a fictional training run across eight nodes. Seven nodes complete each local step in roughly 120 milliseconds; one consistently takes 240 milliseconds. Distributed synchronization may cause faster workers to wait, but the impact depends on the training algorithm and how work is partitioned.
Check the slow node's job logs first. Then compare GPU throttling events, board power limits, SM activity, memory usage, communication errors and host resource contention. If a thermal-limit event aligns with the slow steps, involve facilities to verify the relevant cooling system. If a high fabric error rate appears instead, investigate the interconnect. One plot cannot establish causation.
This procedure creates an actionable ticket: “Node 8 slower under the same job configuration; correlate throttling and network counters with step timestamps.” It is much more useful than an alert saying “GPU utilization below 90%.”
Set alerts that lead to a decision
A single global temperature threshold such as “HBM above 72°C” is not portable across architectures, sensors or firmware. NVIDIA publishes supported field identifiers including device temperatures, thermal margins, supported power limits and health counters. Where available, compare values against the device's documented operating thresholds and validated local policy.
- Alert on actual faults promptly. Device health events, repeated resets and loss of service need clear ownership.
- Use trend or deviation alerts for performance. Compare relevant peers and similar workloads instead of a single universal percentage.
- Correlate events. Join GPU, scheduler, fabric and facility telemetry using reliable timestamps.
- Preserve diagnostic context. Record the job ID, GPU model, driver version, firmware, power policy and node placement.
Who should act when a metric changes?
Job throughput, batch settings, queues, application errors and performance regressions.
GPU health, firmware and drivers, server power limits, network and interconnect faults.
Cooling delivery, rack input power, branch capacity, UPS events and environmental alarms.
Agree the escalation boundary in advance. A facility engineer should not change cooling setpoints based solely on a GPU utilization chart; an ML engineer should not override hardware protections to recover training speed.
Takeaway: monitor completed work first, then use GPU and facility telemetry to explain why it changed. The best dashboard leads to a specific next action and a verified outcome.
Sources and further reading
Primary frameworks and reference materials. Engineering decisions require site-specific validation; legal classifications require assessment of the actual use case.