
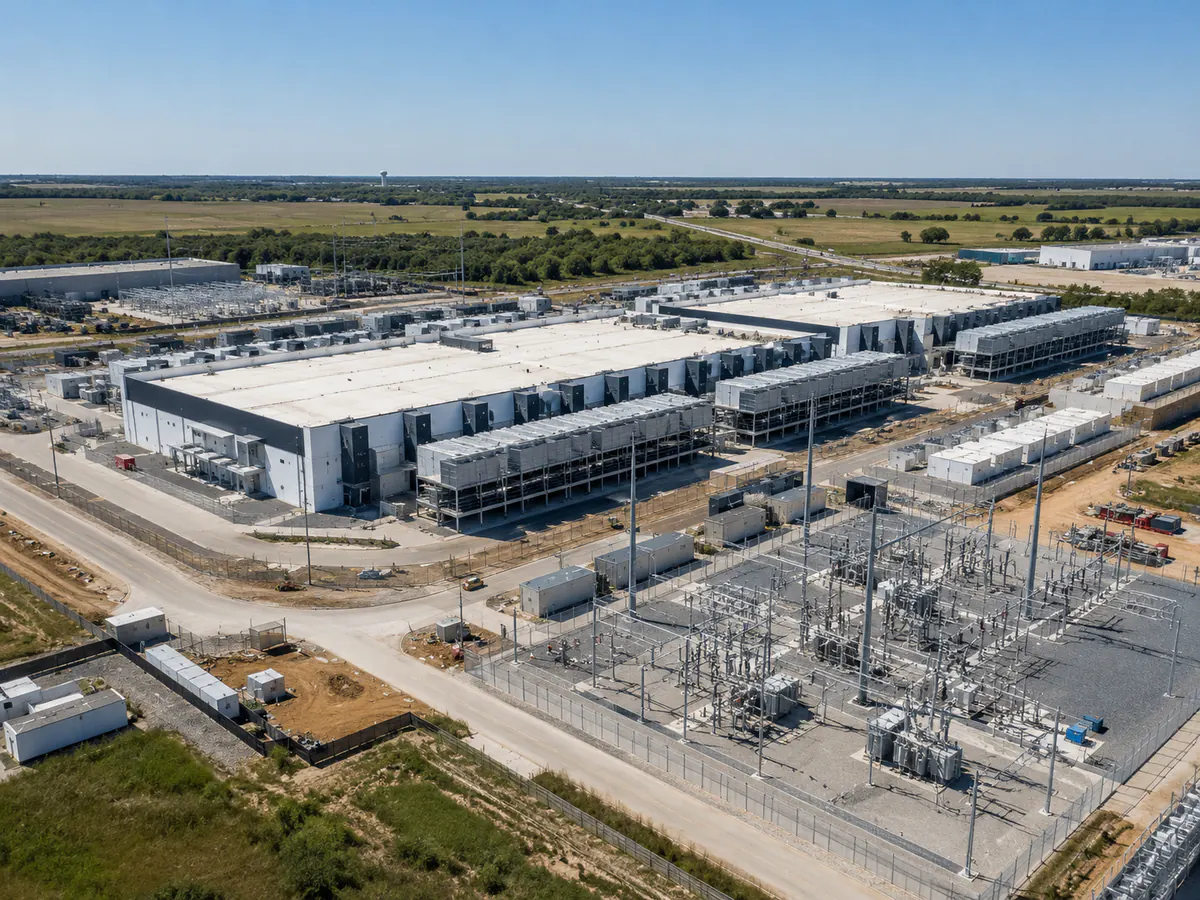
If I had to put a 2026 screening range on a large U.S. data center before seeing the design, I would start at roughly $10 million to $14 million per MW of IT load for conventional large-scale construction in the major markets covered by current industry benchmarks. I would also write a warning next to that number: it is not an all-in development cost, and it becomes much less useful as soon as the project moves away from the assumptions behind it.
That caveat matters more than it may sound. A 20 MW air-cooled building in Phoenix, a multistory facility in Northern Virginia and a liquid-cooled AI deployment can all be described as “data centers,” but their budgets are built differently. Land may be excluded. Active IT equipment may be excluded. Off-site utility work can sit elsewhere. Even the megawatts in the denominator need to be defined properly.
So I use cost per MW as a comparison tool rather than a quote. It is useful when it helps us compare markets, facility types and design choices on a consistent basis; it becomes misleading when a benchmark is copied without its scope.
Current industry benchmarks support a fairly clear starting range. JLL forecasts an average global shell-and-core construction cost of $11.3 million per MW in 2026, up from $10.7 million in 2025. Its U.S. market ranges run from roughly $10 million per MW in several Sun Belt markets to $14 million at the upper end of Chicago. JLL's 2026 Global Data Center Outlook is the main benchmark I use below.
What data centers cost per MW in major U.S. markets
JLL's 2026 figures are useful because they use a consistent baseline: a single-tenant, 50 MW, air-cooled data center, with the cost expressed against IT capacity. That gives us an apples-to-apples comparison across the five U.S. markets in its published table.
| U.S. market | 2026 construction cost | Illustrative 20 MW project |
|---|---|---|
| Chicago | $12M–$14M per MW | $240M–$280M |
| Northern Virginia | $11M–$12M per MW | $220M–$240M |
| Phoenix | $10M–$11M per MW | $200M–$220M |
| Dallas | $10M–$11M per MW | $200M–$220M |
| Atlanta | $10M–$11M per MW | $200M–$220M |
I would resist reading too much into a $1 million-per-MW gap without looking at the project behind it. On a 50 MW campus, that difference can translate into $50 million, so it clearly matters. But the cheapest construction market is not automatically the cheapest place to deliver capacity. Power availability, grid work, land, tax treatment, schedule and the cost of carrying a delayed project can outweigh a lower headline construction benchmark.
Turner & Townsend's 2025–2026 cost index points in the same general direction while using its own methodology. It reported Silicon Valley at about $13.3 per watt, New Jersey at $12.9, Atlanta at $9.9, Phoenix and Columbus at $9.8, and Charlotte at $9.5. Because methodologies differ, I would use those numbers as a cross-check rather than merge them into a single synthetic national average. Turner & Townsend publishes the market-level figures and methodology.
The most important question: what is included?
This is where data center cost comparisons go wrong most often. Two sources can publish very different numbers and both can be reasonable if they are measuring different scopes.
JLL's 2026 benchmark is explicitly a shell-and-core construction cost. It excludes land acquisition and active IT equipment. JLL also notes that the technology fit-out paid by tenants can be extremely large for AI infrastructure, reaching as much as $25 million per MW in some cases.
Turner & Townsend's benchmark captures construction under headings that include shell and core, architectural fit-out, mechanical and electrical fit-out, contractor preliminaries, margins, contingencies and M&E equipment. Its baseline is a typical 30–50 MW air-cooled hyperscale facility. That is why I always check the methodology before comparing two $/MW figures.
What sits behind the $/MW number
What may still sit outside the benchmark is just as important: land, financing, major off-site utility reinforcement, owner-specific technology, servers, GPUs, network equipment and other active IT assets can transform the total capital requirement.
AI changes the economics, but not in one simple way
The AI build-out is one reason older data center benchmarks age quickly. Higher rack densities affect power distribution and thermal design, and liquid cooling introduces infrastructure that conventional air-cooled facilities may not need.
JLL applies roughly a 10% construction premium for liquid-cooled facilities in its 2026 comparison. Turner & Townsend independently reports a 7% to 10% premium for comparable U.S. liquid-cooled projects. CBRE's 2026 midyear outlook goes further at the demanding end of the market, putting high-density builds around $14 million to $16 million per MW.
I would treat those figures as evidence of direction rather than as a universal “AI premium.” A project does not become 10% more expensive simply because the word AI appears in the brief. Rack density, cooling architecture, electrical topology, redundancy, equipment selection and the amount of owner-furnished technology all matter.
A 50 MW Northern Virginia facility
Using JLL's $11M–$12M per MW shell-and-core range, a conventional air-cooled 50 MW project lands at roughly $550M–$600M before land and active IT equipment. If a comparable design required a 10% liquid-cooling construction premium, the construction range would move to roughly $605M–$660M.
That is already a $55M–$60M change before touching the IT hardware. And JLL's separate warning that AI technology fit-out can reach up to $25M per MW shows why an “all-in AI data center cost per MW” can be dramatically higher than a shell-and-core benchmark.
Multistory construction is another major adjustment
JLL recommends adding around 20% to construction costs for multistory facilities in the Americas. That is large enough that I would never apply a low-rise market benchmark unchanged to a vertical project.
There are good reasons developers consider multistory designs: land constraints, proximity to demand and the economics of a particular site can make vertical construction worthwhile. But the structural and logistical consequences show up in the capital cost. A market that looks inexpensive on a simple $/MW table can therefore become expensive once site constraints force a different building form.
Three examples that show why scope matters
20 MW in Dallas
At JLL's $10M–$11M per MW range, the shell-and-core construction benchmark is roughly $200M–$220M. That is a sensible first-pass construction envelope, not a total development budget.
20 MW in Chicago
Using $12M–$14M per MW, the equivalent first-pass range becomes roughly $240M–$280M. The same nominal IT capacity therefore carries a potential $40M–$60M construction difference versus the Dallas example.
50 MW high-density project
A high-density build using CBRE's $14M–$16M per MW range implies roughly $700M–$800M of construction cost. If somebody then compares that figure with a $10M/MW shell-and-core benchmark from a different facility type, the conclusion will be misleading before the analysis has even started.
Why construction cost is still rising
The sector has been absorbing several cost pressures at the same time: huge development pipelines, scarce skilled trades in major data center markets, long lead times for electrical equipment, and increasingly demanding power and cooling specifications.
JLL says the global average construction cost rose from $7.7M per MW in 2020 to $10.7M in 2025, roughly a 7% compound annual increase, and forecasts another 6% rise to $11.3M in 2026. Its 2026 U.S. construction update also points to tariffs, energy prices and labor as cost drivers, particularly in markets where data center demand is competing aggressively for contractor capacity.
Turner & Townsend sees some moderation for traditional cloud facilities, but not a return to cheap construction. Its 2025 index recorded a 5.5% increase in cost per watt for conventional air-cooled data centers, while survey respondents continued to expect further bid-price increases into 2026.
Cost per MW is useful, but it is not a business case
I like $/MW because it lets us normalize projects that would otherwise be hard to compare. I do not like it when it becomes the entire decision.
A project with a lower construction cost per MW can still be economically worse if it waits longer for utility power, requires expensive transmission work, sits in a market with higher operating electricity costs or forces a design compromise that limits usable rack density. The reverse can also be true: paying more to build in a constrained market can make sense if the location solves a latency, customer or capacity problem that is worth more than the construction premium.
JLL's 2026 outlook makes this explicit in a useful way: speed to power is now the primary site-selection criterion in its research, ahead of factors such as community support, latency and customer proximity. Construction cost matters, but power availability can decide whether a project exists at all.
How I would build a first-pass budget
For early-stage comparison, I would start with a market benchmark and then make the adjustments visible rather than burying them in one “average” number.
- Define the MW correctly. Use IT load if that is what the benchmark uses.
- Pick a market-specific construction range. Avoid a national average when a local benchmark exists.
- Match the facility type. Hyperscale, enterprise and multi-client colocation facilities do not necessarily carry the same $/MW economics.
- Adjust for cooling and density. Do not treat a high-density liquid-cooled design as a conventional air-cooled project.
- Adjust for form factor. Multistory construction can materially change the budget.
- List exclusions separately. Land, off-site power work, financing and active IT equipment deserve their own lines.
- Escalate to the expected procurement date. A benchmark is only as current as the prices behind it.
This method is less elegant than saying “a data center costs $11 million per MW,” but it is much more useful. It also makes assumptions easy to challenge. If the cooling concept changes or the project moves from Dallas to Chicago, you can see exactly which part of the estimate needs to move.
A workable 2026 screening range
For a conventional large U.S. data center in 2026, I would use $10M–$14M per MW of IT capacity as a broad shell-and-core screening range, then narrow it immediately using the target market and design. For the most demanding high-density projects, $14M–$16M per MW is a more realistic construction reference based on CBRE's current outlook.
I would not call either number “all-in.” Land, utility-specific work and active IT equipment can add enormous amounts, and an AI technology fit-out can dwarf the difference between two shell-and-core markets. The professional answer is therefore a range with a defined scope, not a single impressive-looking number.
That distinction sounds small, but it is the difference between using cost per MW as a useful benchmark and using it as false precision.