
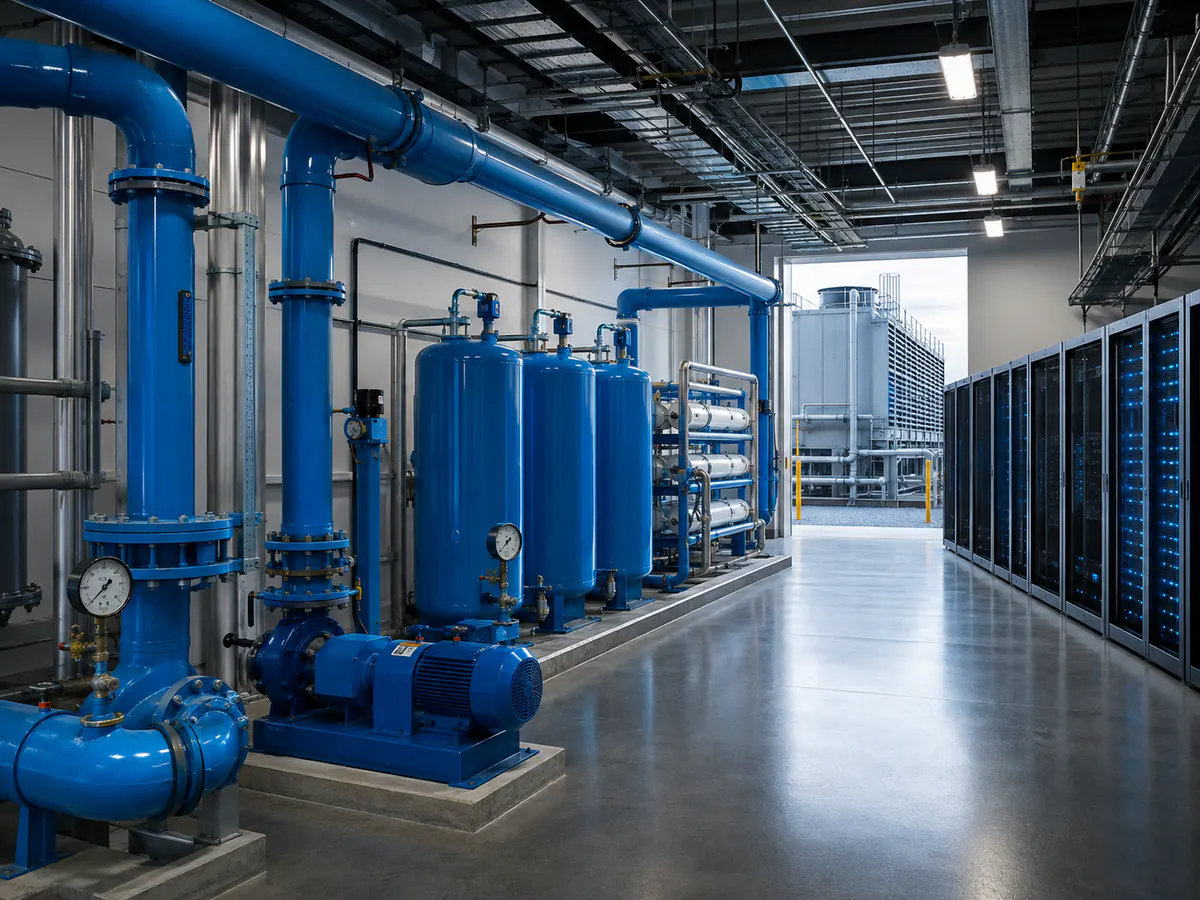
A 10 MW data center can use almost no water for cooling — or more than ten million gallons a year — without changing the amount of IT power it delivers.
The difference is not the size of the servers. It is the way the facility rejects heat.
That is why “how much water does a data center use?” has no useful answer in gallons until three things are known: IT energy, cooling architecture and climate. A fourth factor — the electricity mix — matters if indirect water consumption from power generation is included.
The best public U.S. benchmark still comes from Lawrence Berkeley National Laboratory. Its national model estimates an average site Water Usage Effectiveness, or WUE, of just over 0.36 liters per kWh of IT energy in 2023. Its modeled range rises to about 0.45–0.48 L/kWh after 2023 as hyperscale, colocation and liquid-cooled AI deployments take a larger share of the fleet.
Those numbers are useful. They are not a promise that a particular 10 MW facility will consume 0.45 L/kWh.
Assumes 10 MW of average IT load for 8,760 hours. WUE measures water consumed per unit of IT energy, not water withdrawn, and individual facility results can differ dramatically.
WUE is the water equivalent of translating PUE into an operating number
Water Usage Effectiveness is normally expressed in liters per kilowatt-hour. Microsoft defines its operational data center WUE as annual water consumption for humidification and cooling divided by annual IT equipment energy consumption. The metric answers a simple question: how much water is consumed for every kWh used by the IT equipment?
If a facility averages 1 MW of IT load for a full year, the servers consume 8.76 million kWh. At WUE 0.36 L/kWh, site water consumption is approximately 3.15 million liters, or about 833,000 U.S. gallons.
Scale that to 10 MW and the number becomes roughly 8.3 million gallons. At 100 MW, the same WUE would imply about 83 million gallons per year.
The relationship is linear. The difficult part is choosing a defensible WUE.
The U.S. fleet used about 66 billion liters directly in 2023
Berkeley Lab's 2024 U.S. Data Center Energy Usage Report estimates that American data centers directly consumed about 66 billion liters of water in 2023, equivalent to roughly 17.4 billion U.S. gallons.
Hyperscale and colocation facilities accounted for 84% of that modeled total. In 2014, by contrast, U.S. data centers consumed about 21.2 billion liters and internal enterprise data centers were the largest contributor. The Berkeley Lab report shows how both the size and structure of the fleet have changed.
This national number is often more dramatic than useful for a site decision. Water stress is local. Sixty million gallons in one watershed can matter more than several times that amount in another region with abundant supply and little competing demand.
Uptime Institute makes exactly this point in its 2025 analysis: water does not fit a standard data center template because local restrictions, competing users, watershed withdrawal limits, climate and cooling design all change the impact. Uptime's conclusion is essentially that gallons need geography before they become a meaningful sustainability metric.
Direct water use and indirect water use are completely different numbers
A facility can consume water onsite through cooling towers, humidification or other processes. That is direct water consumption.
Electricity can also carry a water footprint. Thermal power plants may consume water for cooling; hydroelectric systems lose water through reservoir evaporation. That water is consumed somewhere on the grid rather than inside the data center fence.
Berkeley Lab estimates that U.S. data centers' indirect water footprint from electricity generation was nearly 800 billion liters in 2023 — more than ten times the estimated 66 billion liters consumed directly onsite. Its national average was about 4.52 L/kWh of electricity consumed.
Modeled direct U.S. data center water consumption in 2023.
Modeled indirect water footprint associated with electricity use in 2023.
Those two figures should not simply be added and called a facility's “water use.” They represent different boundaries, different locations and different management levers.
Berkeley Lab also cautions that its indirect-water methodology uses regional grid mixes and does not incorporate every facility's individual power-purchase agreements or behind-the-meter generation. A data center buying from a different generation mix can therefore have a substantially different indirect footprint.
The biggest water decision is usually made at heat rejection
Inside a data center, heat can move through several loops before it reaches the outside environment.
Air can carry heat from servers to a CRAH. Direct liquid cooling can carry heat from cold plates to a CDU. A chilled-water loop can move that heat to a central plant. None of those steps necessarily consumes large amounts of water.
The decisive question is often what happens at the end of the chain.
Open cooling towers consume water because evaporation is part of how they reject heat. Dry coolers can reject heat without evaporating water. Adiabatic and hybrid systems sit between those extremes and may use water only during certain weather conditions.
This is why saying “liquid cooling uses water” is too imprecise. A closed liquid loop can circulate the same coolant repeatedly while the facility ultimately rejects the heat through dry equipment with almost no ongoing evaporative water consumption.
Liquid cooling can increase or decrease site water use depending on what comes after the CDU
Berkeley Lab's national model projects a modest increase in average U.S. WUE as liquid-cooled AI becomes more prominent, partly because some modeled liquid-cooled systems still use evaporative heat rejection.
Microsoft provides a useful counterexample from an actual operator. Its latest published fleet data puts global WUE at 0.27 L/kWh for FY2025, down from 0.30 the year before. Microsoft also says its new AI-optimized data center design uses direct-to-chip cooling in a closed loop and consumes zero water for cooling during operations. Microsoft says around 90% of its owned 2025 fleet already used low- to zero-water cooling systems.
Both observations can be true. Berkeley Lab is modeling the changing U.S. fleet under a set of cooling-system assumptions. Microsoft is reporting the performance of its own portfolio and introducing designs intended to avoid evaporation.
This is one of those places where averaging sources would make the article worse. The apparent disagreement tells us something useful: “liquid cooling” is not enough information to predict water consumption.
Waterless cooling does not automatically mean a disastrous PUE penalty
The traditional trade-off is straightforward: evaporating water can reject heat efficiently, while fully dry mechanical cooling can require more electricity in hot conditions.
Microsoft explicitly acknowledges this. Its zero-water design replaces evaporative cooling with mechanical systems and expects a nominal increase in annual energy use compared with its evaporative designs. The company argues that warmer chip-level liquid temperatures help limit that penalty.
Uptime Institute's April 2026 operational analysis makes the trade-off more interesting. After examining PUE and WUE data across multiple facilities and climate zones, Uptime found that well-designed dry and adiabatic systems can match or outperform evaporative systems on PUE while consuming zero or near-zero water. Its conclusion is that design, configuration, free-cooling utilization and operational discipline can matter more than the cooling-system label alone.
That does not prove dry cooling is always the better choice. It does undermine the simplistic assumption that low water consumption must always be purchased with poor energy efficiency.
Climate can change annual water use even when the equipment is identical
An adiabatic or hybrid cooling system can spend much of the year in dry mode in a cool climate and use water only during hotter periods. Place the same system in Phoenix and the wet-mode operating hours can increase substantially.
Microsoft offers a concrete illustration from its own fleet. The company says water may be required for direct-air evaporative assist less than 5% of the year in cooler locations such as Dublin and Amsterdam, roughly 10% in Virginia and as much as 40% in Phoenix.
That is not a universal climate model, but it shows why annual water consumption cannot be inferred from equipment type alone.
Berkeley Lab's national methodology accounts for this by using hourly climate data from 965 U.S. weather stations when simulating cooling-system PUE and WUE.
Seasonal peaks matter more to local infrastructure than annual averages suggest
A facility may report a respectable annual WUE while using most of its cooling water during the hottest weeks of the year.
That is exactly when municipal systems, agriculture and other users can also face high demand.
For site planning, I would therefore want more than annual gallons. Monthly or daily peak withdrawal and consumption can be more important to the utility and community than the yearly total.
Uptime notes that economizers can provide anywhere from about 30% to 80% of cooling depending on climate and system design. A temperate facility can therefore have a very different seasonal water profile from one in an arid market even when both publish a similar annualized metric.
Withdrawal and consumption are not the same thing
Water reporting gets confusing because “water used” can describe at least two different quantities.
Withdrawal is water taken from a source. Consumption is the portion that is not returned to the immediate water system, usually because it evaporates or becomes otherwise unavailable for reuse.
Cooling towers can withdraw more water than they ultimately consume because some blowdown water is discharged. Closed-loop systems can contain a large volume of water while consuming very little after the initial fill.
WUE is generally a consumption metric. Comparing it with a municipal withdrawal number without checking definitions can create a large apparent discrepancy that is only an accounting-boundary problem.
Potable water versus reclaimed water changes the local impact
Two facilities can consume the same number of gallons and place very different pressure on drinking-water resources.
Operators increasingly use reclaimed wastewater, recycled water or other non-potable sources where local infrastructure permits it. Microsoft, for example, says it has expanded alternative-water sourcing in locations including Texas, Washington and California.
From a cost perspective, alternative sources can require treatment equipment, pipelines or contracts that make the water itself more complicated than the municipal tariff suggests. From a community perspective, avoiding potable supply can be more valuable than a small improvement in headline WUE.
This is another reason Uptime's “water is local” framing is useful. Volume is only one dimension.
AI does not automatically mean more water per unit of compute
AI increases total power demand, which can increase total cooling requirements and therefore total water consumption. That is the scale effect.
But AI hardware also accelerates the move toward direct liquid cooling, warmer coolant loops and purpose-built heat rejection. Those technologies can reduce water intensity depending on the final system design.
Berkeley Lab's 2025 workload-level water study found variation of more than 10,000-fold between workloads when direct and indirect determinants are considered. The strongest factors included server efficiency, grid water intensity, utilization, cooling system, infrastructure efficiency, climate, inactive-server share and server refresh cycle. The paper's central conclusion is that there is no single recipe for minimizing water use.
This is a much stronger result than saying “AI uses X liters per query.” The physical and geographic context can change the answer by orders of magnitude.
A WUE number needs a boundary before it can be compared
Microsoft's reported fleet WUE of 0.27 L/kWh is not directly interchangeable with Google's Category 2 freshwater WUE or Berkeley Lab's modeled national site WUE. Reporting frameworks can differ in water source, treatment of consumption versus withdrawal, facility scope and time period.
When comparing providers or sites, I would check at least four things: whether the metric is site water or source water; whether it includes only freshwater or all water; whether it measures withdrawal or consumption; and whether the denominator is IT energy measured consistently.
A number with three decimal places is not automatically more comparable than a rougher one.
Use the calculator to translate WUE into annual water consumption
This tool does not estimate WUE for you. It does the safer job: once you have a WUE assumption, it translates that figure into daily and annual water consumption for a chosen average IT load.
Use annual average IT load, not nameplate capacity, unless that is the scenario you intentionally want to test.
This calculator models direct site water consumption from WUE only. It does not include the indirect water footprint of electricity generation, water withdrawals that are returned, or site-specific seasonal peaks.
A 100 MW design can produce a very misleading headline if load factor is ignored
A facility may be marketed as 100 MW while averaging only 60 MW of IT load during an early deployment phase.
At WUE 0.36, modeling the full 100 MW nameplate as if it runs continuously produces about 83 million gallons per year. Model the actual 60 MW average load and the estimate falls to about 50 million gallons.
Both numbers can be mathematically correct for their assumptions. Only one may describe the current operating facility.
This is the same denominator problem that appears in capacity planning: design MW, available MW and actual load should never be allowed to become interchangeable.
Water cost itself may be much smaller than water availability risk
Municipal water can be inexpensive relative to electricity. That can make direct water cost look insignificant in a financial model.
The constraint is often not the commodity price. It is whether the required volume is available during peak conditions, whether permits can be secured, whether local communities accept the demand and whether future restrictions could limit operation.
This turns water from a utility line item into a site-selection variable.
A facility that saves a small amount on cooling energy but depends on a scarce water source may carry more long-term risk than a slightly higher-energy design with negligible water consumption. The reverse can also be true in a water-abundant location with constrained electricity.
PUE and WUE should be read together
Berkeley Lab explicitly warns that low site WUE is not automatically “good” in isolation because waterless systems can sometimes use more electricity. That extra electricity can also create an indirect water footprint depending on the grid.
Uptime's 2026 dry-cooling analysis pushes the industry toward a better standard: evaluate PUE and WUE together, rather than optimizing one resource while ignoring the other.
A facility with PUE 1.20 and WUE 0.8 is making a different resource trade-off from one with PUE 1.28 and WUE 0.05. Which is preferable depends partly on electricity mix, water stress, cost and local constraints.
There is no globally correct answer detached from location.
The most useful water questions are surprisingly practical
Before accepting a water-use estimate, I would ask what cooling system actually consumes the water, whether the reported figure is annual or peak, and what source supplies it.
Then I would ask what happens on the hottest design day. Is the facility still dry cooled? Does an adiabatic system switch into wet mode? What is the maximum daily consumption at full IT load?
For a liquid-cooled AI hall, I would also ask where the liquid loop ultimately rejects heat. A closed-loop CDU inside the building tells us almost nothing about whether the facility evaporates water outside.
Finally, I would separate direct water from the water footprint of electricity generation. Combining both can be useful for environmental accounting, but only if the locations and assumptions remain visible.
The gallon number matters less than the water system behind it
A national model can tell us that U.S. data centers directly consumed about 66 billion liters in 2023. A WUE benchmark can turn a 10 MW load into an annual gallon estimate. Neither tells us whether a particular project is sustainable in a particular watershed.
The real answer depends on whether the facility evaporates water, how often it does so, whether the water is potable or reclaimed, what the local climate looks like and how much water the electricity system consumes upstream.
So “how much water does a data center use?” is best answered in two steps. First, calculate the site's actual WUE against its average IT energy and translate that into gallons. Then ask whether those gallons are being consumed in a place, season and water system that can actually support them. The first step gives you a number. The second tells you what the number means.