
The electrical system is no longer a supporting line item in a data center budget. In a modern project, it can be the part of the development that decides whether the site is affordable, buildable and deliverable on time.
Cushman & Wakefield's 2026 U.S. Data Center Development Cost Guide puts average all-in greenfield development cost for modern facilities at $17.6 million per MW, excluding chips and GPUs. The same research says power infrastructure is the largest single cost category, averaging 21% of total greenfield development cost.
Applied mechanically, 21% of $17.6 million is about $3.70 million per MW. I would use that number as a portfolio-level screening reference, not as an equipment quote. The scope hidden inside “power infrastructure” changes too much from one project to another.
This is an implied category-level benchmark from Cushman & Wakefield's 2026 cost guide. It is not a universal allowance for every site.
Start with the power path, not one cost-per-MW number
A useful power budget follows electricity from the point where the utility serves the site to the point where a rack can actually use it. That path can include infrastructure owned by the utility, equipment owned by the developer, redundant distribution paths and systems whose only job is to keep the load alive when something else fails.
The point is not that every facility contains the same equipment. The point is that a cost model becomes much easier to audit when every dollar is assigned to a specific part of the electrical path.
The component benchmarks explain why the category gets large so quickly
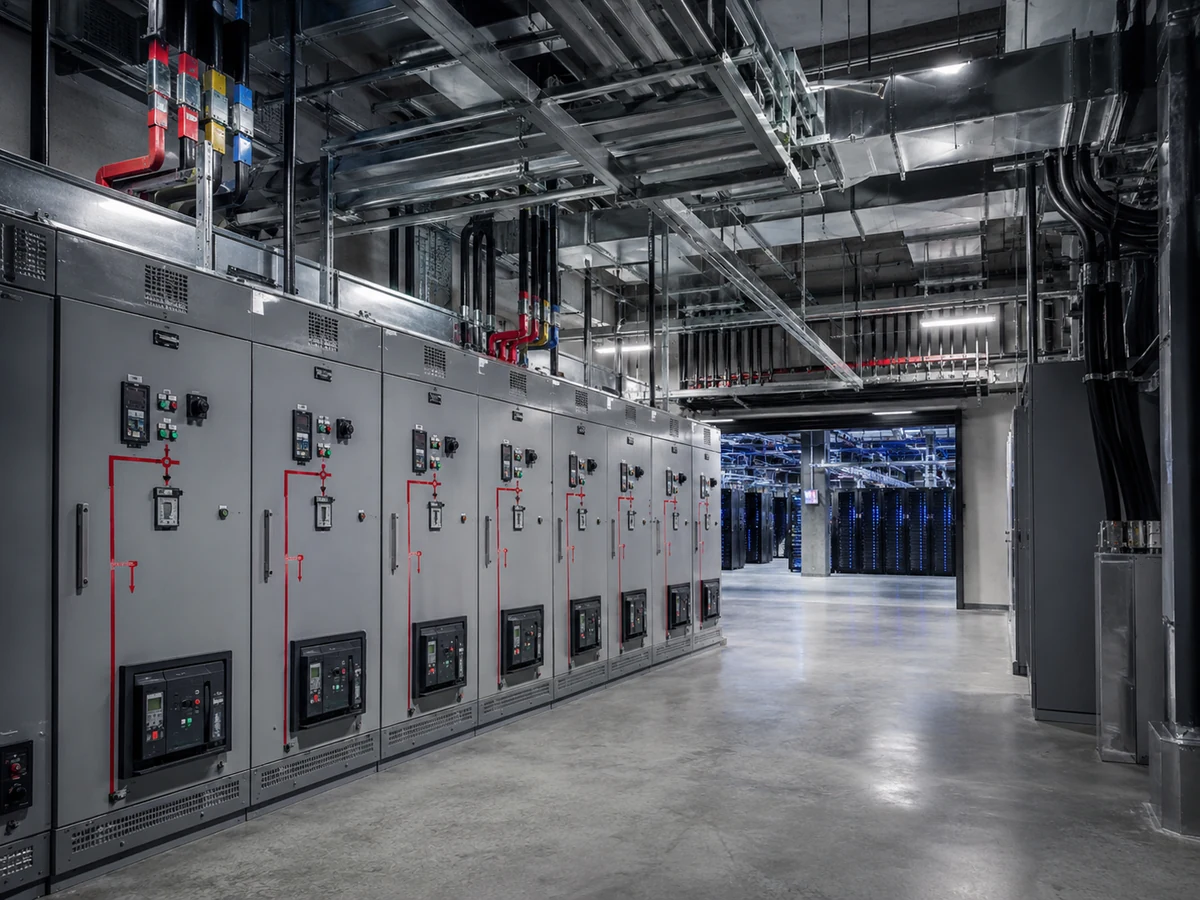
A 2026 Eaton presentation reproducing BofA Global Research benchmarks gives a useful illustration of the equipment stack: roughly $0.8 million/MW for UPS, $0.6 million/MW for generators, $0.5 million/MW for switchgear and $0.2 million/MW for PDUs and busway.
Those four lines already total about $2.1 million per MW. They still do not tell you the full electrical cost of a development because the boundary can also include utility interconnection, substations, transformers, transfer equipment, controls, cabling, installation, commissioning and site-specific civil work.
I would not add these numbers to a contractor proposal or assume they describe a particular redundancy topology. Their value is different: they show which components are large enough to deserve their own assumptions in an early model.
A 20 MW facility shows the difference between a category benchmark and a quote
Take a hypothetical 20 MW IT project. At the Cushman & Wakefield 2026 all-in average, the headline greenfield development budget would be about $352 million. Applying the 21% average power-infrastructure share produces roughly $73.9 million attributable to the power category.
That is a useful reasonableness check. It is not permission to set an electrical budget at $73.9 million and stop engineering. A project with a difficult transmission extension, unusual redundancy, high-density AI distribution or major on-site generation could land materially above the average. A project that receives more utility infrastructure outside the developer's own construction scope could look different in the opposite direction.
The boundary around “power infrastructure” matters more than the percentage
Two cost reports can appear to disagree while both are internally correct. One may include the utility substation and interconnection contribution in the development budget. Another may start at the customer meter. One may count generators in electrical cost. Another may place them under mechanical or resiliency.
- Utility studies and interconnection obligations
- Substation and large transformers
- Medium- and low-voltage switchgear
- UPS systems and batteries
- Standby generation and fuel systems
- Distribution to the rack
- Installation, controls, testing and commissioning
AI changes the distribution problem even when utility MW stays the same
AI infrastructure is pushing much more power into each rack. Schneider Electric's 2026 work contrasts conventional data center racks around 10 kW with high-density AI designs exceeding 140 kW per rack. That changes conductor size, busway, distribution topology, protection, conversion architecture and the interaction between electrical and liquid-cooling systems.
This is one reason a legacy $/MW assumption can become misleading. The same 10 MW of IT can be distributed across many ordinary racks or concentrated into a much smaller number of high-density AI racks. The campus MW is unchanged; the last part of the power path is not.
Higher rack density can move money rather than simply add money
Densification can reduce the number of racks and the amount of white space required for a given IT capacity. At the same time, it can require larger distribution blocks, new busway, different UPS behavior and tighter coordination with cooling. A good model therefore separates facility MW from distribution intensity.
Redundancy is one of the fastest ways to break a simple benchmark
The difference between a capacity number and a resilient capacity number is fundamental. N, N+1, distributed redundant and 2N designs do not require the same amount of installed equipment to support the same usable IT load.
This is why I would not take a 10 MW project, multiply one public UPS number by ten, multiply one generator number by ten and call the result a design. Redundancy, block size, maintainability, failure domains and the desired level of fault tolerance all change installed capacity.
Lead time has become part of electrical cost
Cushman & Wakefield attributes part of the 2026 cost escalation to long material lead times and constraints in critical components. The economic impact is not limited to a higher purchase order. Long-lead equipment can force earlier design freezes, larger deposits, storage, expediting, temporary solutions or a later revenue date.
This is especially visible in transformers. The U.S. Department of Energy notes that large power transformers can cost millions of dollars, are typically custom-made and can require a year or more to replace. Current 2026 market research is still describing transformer supply as constrained.
How I would build the first electrical budget
Use IT MW, facility MW and utility MW as separate numbers.
Decide what capacity must survive maintenance or a fault.
Name the major equipment blocks before assigning dollars.
Compare the engineered subtotal with current market references.
State clearly whether utility work, commissioning, taxes and contingency are included.
So what should go into a 2026 planning model?
For early screening, the strongest current public anchor is that power infrastructure averages about 21% of the $17.6 million/MW greenfield development cost reported by Cushman & Wakefield. That implies roughly $3.7 million/MW at the category level.
I would use that figure to challenge an early budget, not to replace one. The moment the project has a utility point of interconnection, a redundancy concept and an equipment one-line, the estimate should move from a percentage toward actual system quantities.